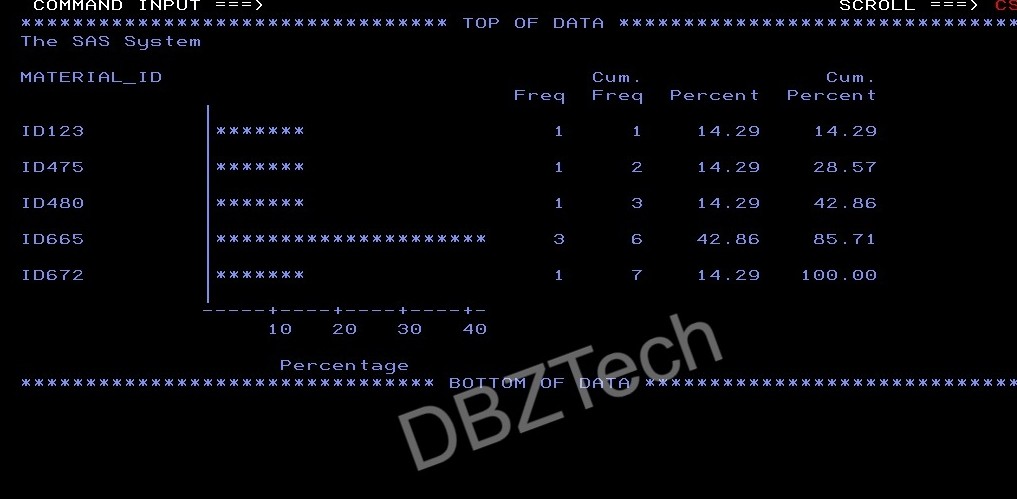
To achieve horizontal bar diagrams, HBAR has to be used in PROC CHART statements. One feature of HBAR is that, it automatically returns the frequency, cumulative frequency, percentage, and cumulative percent to the right of each bar.
Let’s see the output how the same data (as shown in previous posts looks like)
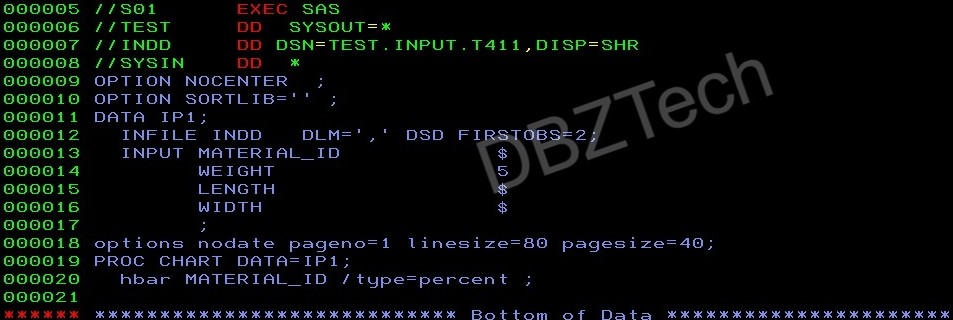
The corresponding code

Leave a comment