Using the PROC CHART option one can generate few graphs(vertical and Horizental) in mainframe or possibly print it to PDF document via the ODS option. In this post, we will see how proc chart can be used to generate a bar diagram in mainframe (Z/OS) world.
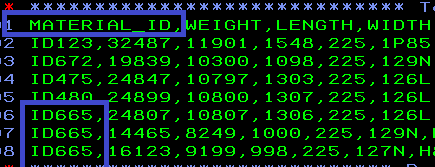
The objective here is to read the input file and mark the frequency of one ID(say Material_ID), i.e., how many times it appears on the input and plot it in bar diagram.
The input file marks the three occurrence of material id ID665. Ideally. So it’s frequency is 3 and the Freq of other material_id is 1.
Let’s plot it in a diagram using the below code.
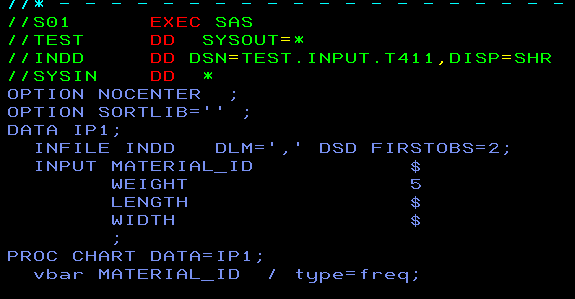
Excluding the type=freq option will give the same output as well. The reason of including the Type parameter will be explained in subsequent posts.
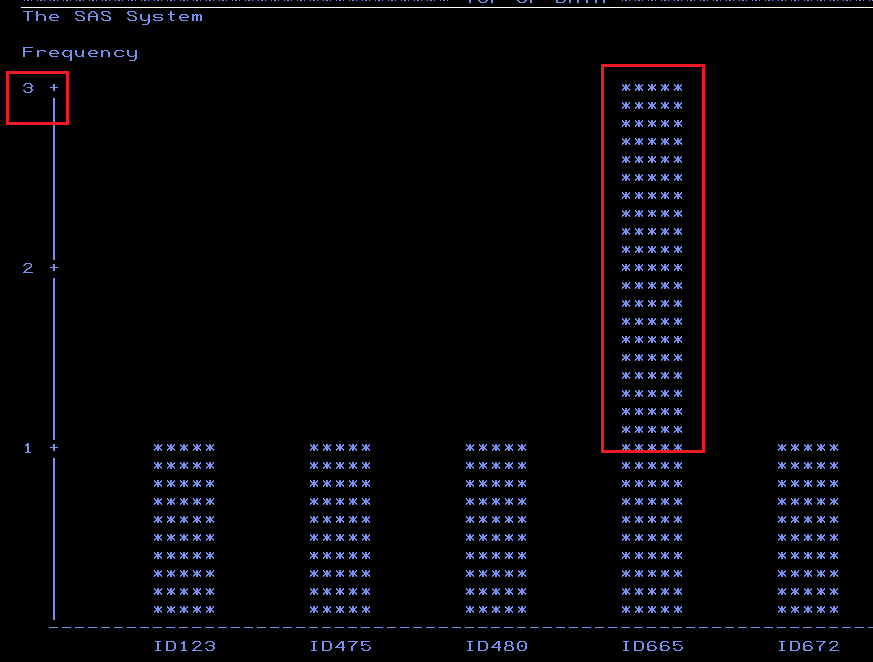
The output in SASLIST in spool will appear as below. Red highlighted boxes are just to indicate for understanding purpose.

Leave a comment